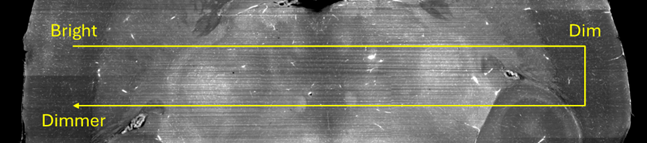
This artifact is primarily caused by photobleaching during bidirectional (S-patterned) scanning.
Photobleaching, the irreversible loss of fluorescent signal due to photochemical damage of fluorophores, is typically induced by excessive excitation. In light-sheet microscopy, photobleaching can be more pronounced because the light sheet spans an entire row of tissue at once. Although only one field of view is recorded at a given moment, all fluorophores located along the illuminated row are exposed to the excitation light sheet simultaneously. As the system scans sequentially across the row, regions imaged first experience minimal bleaching, and those imaged later experience more photobleaching before the image is acquired. Because SLICE tissue scans are sampled with a bidirectional (S-shaped) pattern, photobleaching can lead to:
-
Horizontal intensity gradients within each row.
-
Vertical intensity discontinuities between the first tiles of one row and the last tiles of the subsequent row.
Intrinsic fluorophore properties largely determine the rate of photobleaching. Utilizing optimized photostable fluorescent labels is critical for maintaining signal stability during extended SLICE tissue scans. To further minimize photobleaching, determine the maximum excitation intensity that preserves fluorescent signal (avoids signal decay) over time.
Use BrightSLICE to evaluate photobleaching in real time by monitoring the live signal intensity.
-
In the channel you are assessing, navigate to a non-critical region that still maintains signal levels comparable to your region of interest.
-
Start with a 10% ecitation power and either a 34ms or 51ms exposure.
-
Open the Camera Histogram.
-
Select Optimize to automatically scale the dynamic range. Record the white point value.
NOTE: The white point represents the upper bound of the fluorescence signal at a time point.
-
Wait 5 minutes.
-
Repeat Steps 4 and 5.
-
Continue this process until you have enough data to quantify signal stability over time. Record at least 3 data points.
A loss of less than 5% of the intensity (white point value) over 5 minutes is generally acceptable, indicating that photobleaching will not significantly impact the dataset.
((Timepoint 1 - Timepoint 2) / Timepoint 1) x 100 = % Signal Loss
If greater signal decay is observed, reduce the excitation power and repeat the timepoint test until the intensity decrease is less than 5%. Apply these optimized parameters (excitation power and exposure) when configuring your full-volume tissue scan.
Lastly, BrightSLICE provides post-processing filters that can help mitigate uneven signal distribution across the imaged tissue volume. Specifically, the Flatfield Correction filter is designed to mitigate uneven illumination artifacts across a single field of view (FOV) and across different tiles/regions.